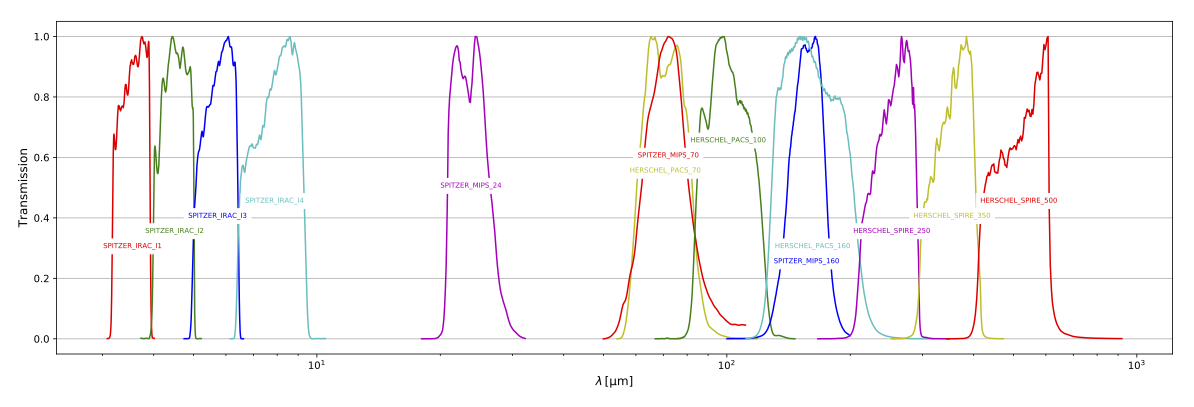
SKIRT and PTS include the same set of built-in transmission curves corresponding to standard broadband filters and instruments. In fact, the broadband resource files loaded by SKIRT have been prepared using PTS. On the SKIRT side, these filters can be used to obsverve broadband-convolved fluxes in instruments and probes, and to normalize the luminosity of a primary source. PTS offers functions to obtain the transmission curves, determine proprties such as the pivot wavelengths, or calculate the convolution with a given spectrum.
For more information, see the SKIRT BroadBand, BandWavelengthGrid, and BandLuminosityNormalization classes, the pts.band.broadband.BroadBand class, and Wavelength grids overview.
The PTS band/list_bands command script lists the names of all built-in broadbands with their corresponding pivot wavelength. The bands are sorted on pivot wavelength within each family:
$ pts list_bands
  Starting band/list_bands...
  There are 85 built-in bands:
  | Band name          | Pivot wavelength
  |--------------------|-----------------
  | 2MASS_2MASS_J      | 1.2393 micron
  | 2MASS_2MASS_H      | 1.6494 micron
  | 2MASS_2MASS_KS     | 2.1638 micron
  ...
  | WISE_WISE_W3       | 12.568 micron
  | WISE_WISE_W4       | 22.314 micron
  |--------------------|-----------------
  Finished band/list_bands.
The PTS band/plot_bands command script creates a plot of the transmission curves for all built-in broadbands that satisfy all of the selection criteria specified as optional arguments:
The resulting plot file is named "FigBuiltinBands.pdf" and is placed in the current working directory.
For example:
$ pts plot_bands --names="spitzer,herschel"
  Starting visual/plot_bands...
  Plotting 13 built-in bands...
  Created .../FigBuiltinBands.pdf
  Finished visual/plot_bands.
$ open FigBuiltinBands.pdf
